Airflow control for critical spaces
This section covers the following topics:
- Airflow control loop
- Tuning values for damper
- Test and adjust tuning parameters
- Face velocity control loop
- Tuning procedure for Face velocity control loop
- Tuning values for venturi
- Venturi calibration
Airflow Control Loop
The flow control loop is tuned to drive the measured air flow to the setpoint. Performance is defined in terms of speed and stability. For critical ventilation systems the desired operation is usually a step response with little overshoot. The expectations and requirements for speed vary. Design and tune the control loop to satisfy expectations.
That means you need to know what performance is expected. Read project specifications, acceptance test descriptions. Talk to customer. Find out what they need. If necessary, write a formal Request For Information.
In addition to achieving the required speed and stability in an individual flow control loop, it may be necessary to match characteristics of the various flow loops in a room. In a pressurized room, air flow rates at the various terminals are coordinated. When the flow at one terminal changes, the control system changes other flows to maintain the necessary balance. During the transition, the flows may be temporarily out of balance, affecting room pressurization. In some cases, customers are concerned with this temporary imbalance; in other cases they are not.
It may be necessary to tune the separate flow loops so they respond at approximately the same speed and minimize fluctuations in room pressurization.
Design consideration - Select actuator with the speed needed to meet requirements and expectations.
Tuning values for damper
Use these settings as a starting point. They should deliver a flow response that is already close to the fastest stable response.
calculate approximate values for starting point
determine the air flow with the damper fully open. (open the damper if working interactively with the real system; guess a value if not)
Gain = configured Max flow / flow @ open damper
configured Max Flow = Largest of: (max cooling flow, max heating flow, max vent. flow, Nominal flow)
(alternate method, if flow @ open damper is too high to read or too high for realistic tuning
find damper setting where flow is approximately equal to Max flow (or Nominal flow if Nominal is more than max)
Gain = damper @ Max flow / 100
or Gain = damper @ Nominal flow / 100 if Nominal flow is more than Max flow)
Calculate Tn = actuator stroke time / 2
Set Trise and Tfall = actuator stroke time
Neutral zone = relative flow setpoint at minimum flow / 20
(If minimum flow is very low, or zero, this does not work. Try max flow/100)
Tuning the airflow response
To test and adjust the airflow tuning parameters you need to start with airflow that is stable at a fixed setpoint. If the airflow is not stable at a fixed setpoint, cut the gain value by half and re-evaluate.
The best way to achieve desired performance is to observe the flow response in a graph. Command the setpoint up and down repeatedly and observe the airflow response (explore the curve, adjust the curve). If you don’t have a visual graphical flow interface - if you’re not able to see the flow superimposed on a graph - you can still watch the measured flow value change in response to sash positioning and override commands. The following graphics show various responses and what you should adjust to reach desired performance.
Graphic 1
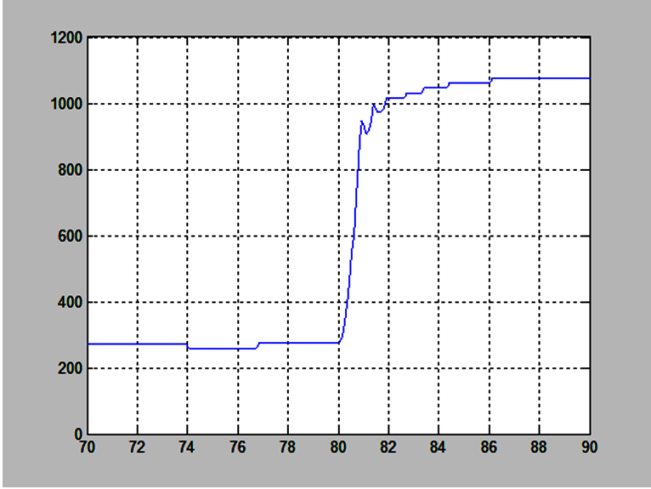
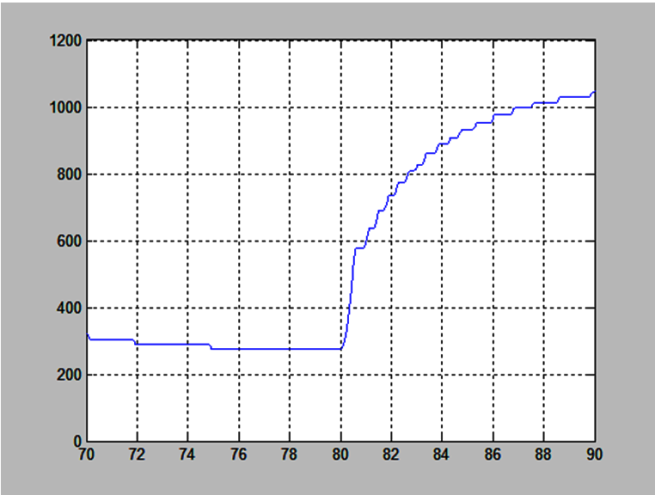
Graphic 1 shows a response curve that can be used as a starting point for illustration purposes. For example, if for some reason you needed a slower response you could reduce the gain. Cutting the gain in half will make the response approximately 2x longer. Graphic 2 shows what this might look like.
|
|
| |
| |
| |
Measured flow | |
| |
| |
| |
| |
| |
| |
| Time in seconds |
Graphic 2 – slower response after reducing gain
In Graphic 1 the response takes a little over 4 seconds to reach setpoint. Graphic 2 shows the response after cutting the gain in half. The response is now approximately twice as long (over 8 seconds). This is a smooth and well controlled response curve with zero overshoot.
|
|
| |
| |
| |
Measured flow | |
| |
| |
| |
| |
| |
| |
| Time in seconds |
Graphic 3 – undershoot
In this graphic the response curve shows a quick initial response that suddenly stops and then slowly moves toward setpoint. Note the difference between graphic 2 and graphic 3. In graphic 2 the response curve as it approaches setpoint is gently curved. In graphic 3, the approach to setpoint is almost a straight line. For undershoot, reduce Tn value.
|
|
| |
| |
| |
Measured flow | |
| |
| |
| |
| |
| |
| |
| Time in seconds |
Graphic 4 – undershoot with change of direction
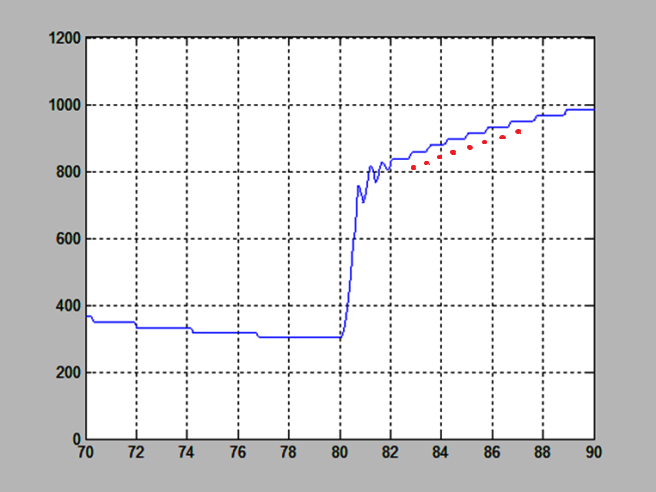
If there is a strong initial response but then a change of direction, reduce Tn.
|
|
| |
| |
| |
Measured flow | |
| |
| |
| |
| |
| |
| |
| Time in seconds |
Graphic 5 – overshoot
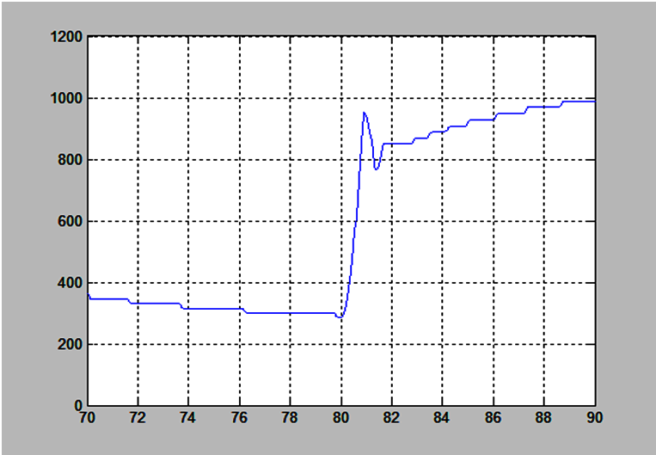
For a large overshoot, increase Tn.
|
|
| |
| |
| |
Measured flow | |
| |
| |
| |
| |
| |
| |
| Time in seconds |
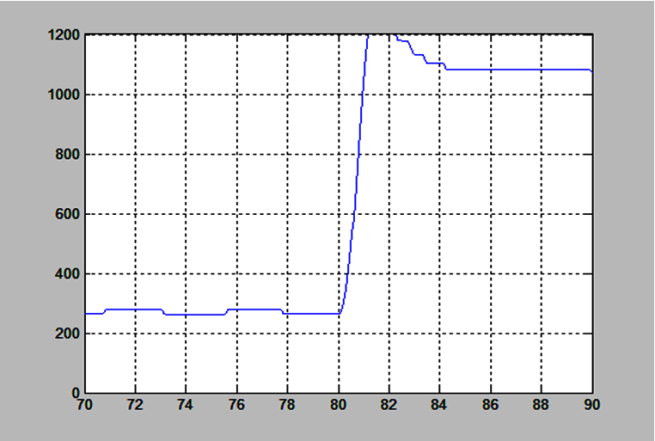
Graphic 6 – damper moves too often, is searching
If the damper is searching with frequent direction changes, reduce the gain (but note that this will slow the step response as in graphic 7).
|
|
| |
| |
Measured flow | |
| |
| |
| |
| |
| |
| |
Damper position | |
| |
| |
| |
| |
| Time in seconds |
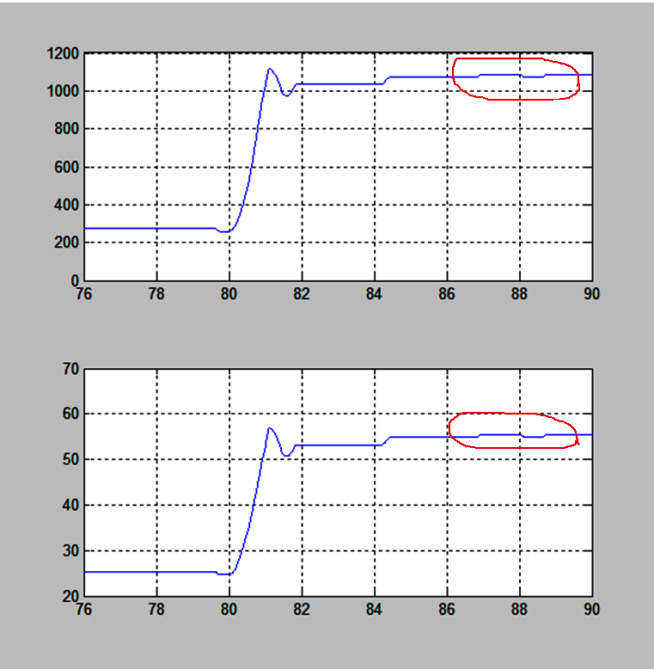
Graphic 7 – decreasing the gain to stop frequent directional changes
In graphic 6 the damper was changing direction ("searching") too frequently. In graphic 7, after reducing the gain, the searching has stopped. However, this also slowed the response time needed for reaching setpoint. It now takes approximately 7 seconds to reach setpoint. See graphic 8 for how to reduce frequent directional changes without slowing the response.
|
|
| |
| |
Measured flow | |
| |
| |
| |
| |
| |
| |
Damper position | |
| |
| |
| |
| |
| Time in seconds |
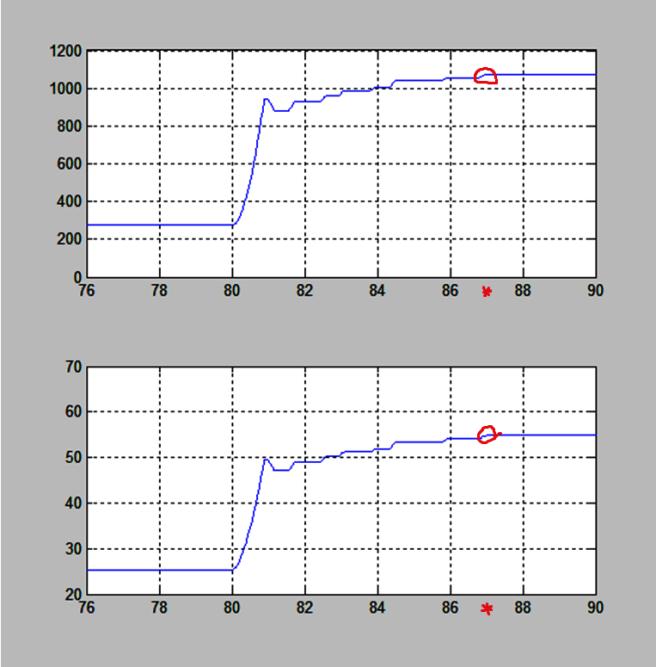
Graphic 8 – remove searching but maintain speed
To move the damper less often but maintain speed, increase Nz and then reduce both gain and Tn by approximately the same ratio (for example if gain = 0.7 and Tn = 1.0 then reducing each by 20% would result in gain = 0.56 and Tn = 0.8). Check responsiveness at low flow.
In graphic 8 the flow response is crisp and short with no overshoot or undershoot. The setpoint is reached quickly and the system immediately settles into stable flow.
|
|
| |
| |
Measured flow | |
| |
| |
| |
| |
| |
| |
Damper position | |
| |
| |
| |
| |
| Time in seconds |
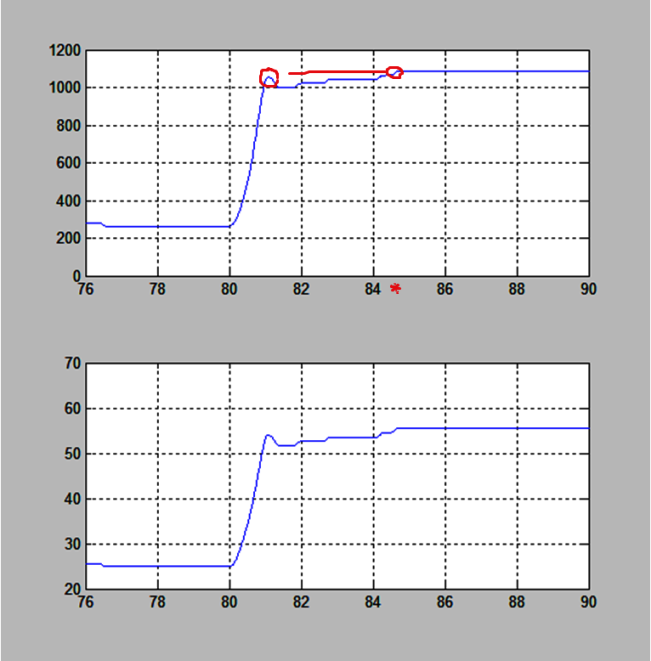
Additional tuning hints
- If you see good response for small flow changes but overshoot on large steps, increase the Rise and Fall times for the actuator. Repeat the step flow changes and observe the new response.
- If you are unable to meet performance expectations, rethink what might be wrong. Here are some things to consider:
- Actuator speed – is the actuator being used the right one for the job.
- PID controller parameters – check PID settings to make sure nothing is overlooked.
- Airflow control loop – is there too much delay in the flow sensing system. Some flow sensors have a time constant of several seconds, and there is also a noise filter in the flow control AF (CetVavSu xx). Either of these can limit the speed of the airflow control loop. Check the value of the noise filter in the flow control AF. Values larger than zero for TiConAirFl (Time constant for air volume flow) will slow the sensor response.
Face velocity control loop
The face velocity control loop is tuned to drive the value indicated by face velocity sensor to the setpoint. Performance is defined in terms of speed and stability. The desired response to a sash movement is usually quick but with very little overshoot. The expectations and requirements for speed vary. Design and tune the control loop to satisfy expectations. This means: you need to know what performance is expected. Read project specifications, acceptance test descriptions. Talk to customer. Find out.
Expect a slower response for a face velocity loop compared to a flow control loop.
Design issues
This loop works in a cascade arrangement with the exhaust flow control loop. Therefore it depends on the performance of the exhaust flow loop. If the exhaust flow control loop has not been properly tuned, the face velocity loop will be difficult to tune and will not perform as well as it should.
Tuning procedure for face velocity control loop
1) Tune the air flow control loop first, following the flow control loop procedures. Manually commanding the flow setpoint to observe performance. Observe the approximate response time of the flow control loop. Note the time needed to get about half way to the new value when the setpoint is commanded. (use in step 3)
2) Evaluate stability of measured velocity signal at constant flow. Check at high and low opening. Open far enough that velocity is in the intended control range (velocity close to setpoint). If the measured velocity fluctuates too much, increase the filter time constant (Face velocity attenuation filter AtnFltVFace in FhSpEh13). Values in the range of 1 to 5 seconds might be appropriate.
3) Set starting values for FV loop parameters:
Gain = (100% / FV setpoint) * (Min flow / Scaling flow)
Tn = FV filter time + Flow control loop time
Rise Time = stroke time of actuator
Fall Time = stroke time of actuator
Neutral Zone = FV setpoint * 0.03
4) Observe and adjust operation of loop.
Is it or does it:
- Stable at a fixed sash opening
- Hold face velocity (or air flow limit) at various openings
- Increase quickly when sash opens .. is there overshoot
- Decrease quickly when sash closes .. is there overshoot

You might see the flow setpoint overshoot significantly. Don’t use this to evaluate the response. Check the actual flow and the velocity indicated by the face velocity sensor. In a cascade control design, it is normal for the exhaust flow setpoint to overshoot and come back to meet the actual flow at the level needed for face velocity control.
Tuning values for venturi
Use these settings as a starting point. They should deliver a flow response that is already close to the fastest stable response.
- Gain = flow @ open damper / 4
(see note if flow is too high to read or too high for realistic tuning) - Calculate Tn = actuator stroke time / 2
- Set Rise and Fall times = actuator stroke time
- Neutral zone = relative flow setpoint at minimum flow / 5
(if minimum flow is very low, or zero, minimum flow / 5 will not work; in this case try max flow / 25 ) - Calculate flow setpoint time constant = actuator stroke time / 2
If flow @ open damper is too high to read or too high for realistic tuning, find a damper setting where flow is approximately equal to the larger of Max flow or Nominal air volume flow and then calculate the gain as follows:
Gain = damper @ (larger of Max flow or Nominal air volume flow) / 100 / 4
(configured Max Flow = Largest of: max cooling flow, max heating flow, max vent. flow, Nominal air volume flow)
Venturi calibration
This example will use a venturi supply box / air valve, but the same procedure applies to a venturi extract box or a venturi fume hood exhaust (the object names will vary to match the type of venturi air valve: Su.. for supply, Ex.. for extract, and Eh.. for exhaust (fume hood).
In ABT Site, online with the automation station: List view > Room > Supply air VAV
Locate Supply air venturi valve calibration command (VntrSuClbCmd)
Set Venturi valve calibration command to Calibrate.
A pop-up message may notify that the calibration procedure may take some time. Click OK to close the message.
To monitor progress, access the properties of Supply air venturi valve calibration state and go to Remaining calibration time.
Once Remaining clibration time = 0, you can
Calibration error
Active air flow (check this. to change something...
Active valve position
To manually change something, go to:
Inactive air flow
Inactive valve position
(Note: first, lock in your damper to a stable flow, then "hood it" and get a flow reading, then manual override it into Inactive air flow, and click Apply on Venturi valve calibration command. (The system now checks the values you just forced on it, and if they pass, the tables are swapped.)