Trend view
A Trend view allows you to visualize multiple online values in a trend chart. Trends are the recurring samples of data in a graphical format. They show the value of the metric across time. You can see the increase and decrease in trend lines across the graph.
Each data recorded for every value is taken at regular time intervals. The trends are packet information of the digital and analog values of a pin. The graph represents the digital axis data on the Y-axis and Time range on the X-axis. You can use a range of colors to highlight the line depicted on the graph.
1 | Trend table | 2 | Trend graph |
There are two sections in the Trend view:
- Trend table
- Trend graphic
① Trend table
See the following table to understand the different columns available in the trend table.
Properties | Description |
|---|---|
Y axis/trend | Y-axis of the pin/trend values. |
Tag name | The name of the trend value. |
Trend color | The color of the trend value. |
Emphasis | Displays a thick/thin line for the trend value. |
Sampling | Frequency of data displayed. Default value is 0. |
Value representation | Represents the trend values in the form of dots or lines. Default representation is lines. |
Min | Field for displaying the minimum value of an analog axis. |
Max | Field for displaying the maximum value of an analog axis. |
Unit | Unit of the trend. |
Axis position | Position of the y-axis in the chart. Default is right position. |
Axis mode | Aligns the axes to whatever view you are in. |
② Trend graph
See the following table to understand the toolbar of the trend graph:
Icon | Properties | Description |
|---|---|---|
| Horizontal increase | Zoom into the horizontal axes. |
| Horizontal decrease | Zoom out of the horizontal axes. |
| Vertical increase | Zoom into the vertical axes. |
| Vertical decrease | Zoom out of the vertical axes. |
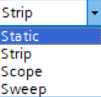
| Display mode | Displays different graph types.
|
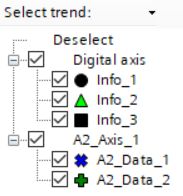
| Select trend | Select which trend values to be displayed. The trend manager visualizes the trend to axis assignments. You can hide trends by disabling the corresponding check box. Hidden trends are no longer recorded in the trend chart, but still displayed in the legend in grayed out mode. Select trends to be edited in the trend manager. In addition to a color code, the trends in the trend chart are also provided with a marker to enable their quick identification in the legend and trend manager. |
| Export as csv file | Exports the trend graph as a CSV file. |
| Import csv file | Imports CSV files. |
| View | Show and hide display the following elements:
|
| Link axes | When a trend is imported, the new x-axis (for example, axis "B") can be linked to the existing x-axis ( for example, axis "A"). In linked mode, axis "B" moves simultaneously with axis "A", but can be adjusted without interfering with axis "A". This mode allows you to compare historic trends with the current trend. |
| Prints the currently displayed trends of the trend chart. | |
| Lock/unlock | Locks/unlocks the trend range along y-axis. Enable write protection or disable it. |
| Time | Displays the time for the left edge of the x-axis. |




 /
/ 

You can add a maximum of 16 Trend views only.